A VirtualBox image has been prepared with all the required software for this workshop pre-installed. You can download it here.
In this workshop you will build a web application with an interactive map using the PDOK (map) services. The web application is build with OpenLayers version 6.2.1, an Open Source JavaScript library.
While building the web application you will learn the difference between the different geo-service types PDOK is providing, such as WMS, WMTS, WFS and WCS. Chapter PDOK and Webservices provides a general introduction on PDOK and the different webservices.
If you want to dive head first in the hands-on part of the workshop go immediately to the workshop.
Publieke Dienstverlening op de Kaart (PDOK) is the geographical open data platform of the Dutch government. PDOK provides geo web services for many Dutch governmental organizations, for instance Kadaster, CBS, RIVM, Rijkswaterstaat and many more.
Due to the open standards policy of the Dutch government, PDOK is using many open standards. Open standard contribute to interoperability and prevent vendor lock-in, this is important since many of the users of the PDOK services are governmental organizations themselves.
Many of the standards used by PDOK concern the web service interfaces, but PDOK also uses a range of different file format standards. For instance for how data providers need to encode their data for delivering to PDOK. Most of these standards are specific for the geographical domain and originate from the Open GeoSpatial Consortium (OGC). The OGC is a non-governmental, industry members organization. Members include big corporations such as Google and ESRI, but also governmental agencies. Members of the OGC cooperate on the development of geospatial open standards. The OGC is very much like the World Wide Web Consortium (W3C), but instead of standards for the web, it makes standards for geospatial.
The traditional standards for geospatial web services are:
PDOK uses all these service standards to make geospatial data accessible over the web. These standards are traditional since these standards are already relatively old (initial release WMS 1999!). The OGC is working hard on developing a new set of standards, based on RESTful principles, with OpenAPI Specifications, following current best practices. This initiative is called the OGC APIs. The development of these standards is work in progress. Also PDOK is involved with the development of this standard by building an OGC API Features implementation (formerly known as WFS 3.0).
Another important (relatively new) mapping technology not mentioned yet is vector tiling. This technology has been around for a while, but unfortunately has not been captured yet in one of the OGC standards. Today everybody pretty much does what Mapbox does, since Mapbox developed most of this technology. Mapbox did publish the Mapbox Vector Tile Specification as an open standard and considering the widespread use we can say that it is a de facto standard. However it lacks the authority of the OGC to make it a de jure standard, which in the context of PDOK and the open standards policy of the Dutch government is deemed quite important. Mapbox provides an excellent introduction on vector tiles. Main advantage of using vector tiles is that it provides a superior user experience, since it allows for dynamic styling and improved interaction with the objects on the map, since vector tiles contain the actual feature data.
So PDOK hosts many services that publish geographic data, but how does one find the right data set and services? There are a number of different ways to go about it:
PDOK website at pdok.nl/datasets. Every service PDOK publishes has a data set page on the PDOK website. The data set page contains a description and links to the service endpoints.
PDOK viewer at pdok.nl/viewer. Almost all services that have a view service (WMS, WMTS, TMS) are listed in the PDOK Viewer. At the moment there is no search functionality in the viewer, so finding the right data set is not so easy.
PDOK Services Plugin for QGIS. The PDOK Services Plugin for QGIS use the CSW service of the NGR to collect all services PDOK hosts and make them accessible in QGIS. I can highly recommend using this plugin. Plugin is Open Source is not build or maintained by PDOK or Kadaster, but is endorsed, see the source code repository. To open the PDOK Services plugin click the orange button in QGIS  .
.
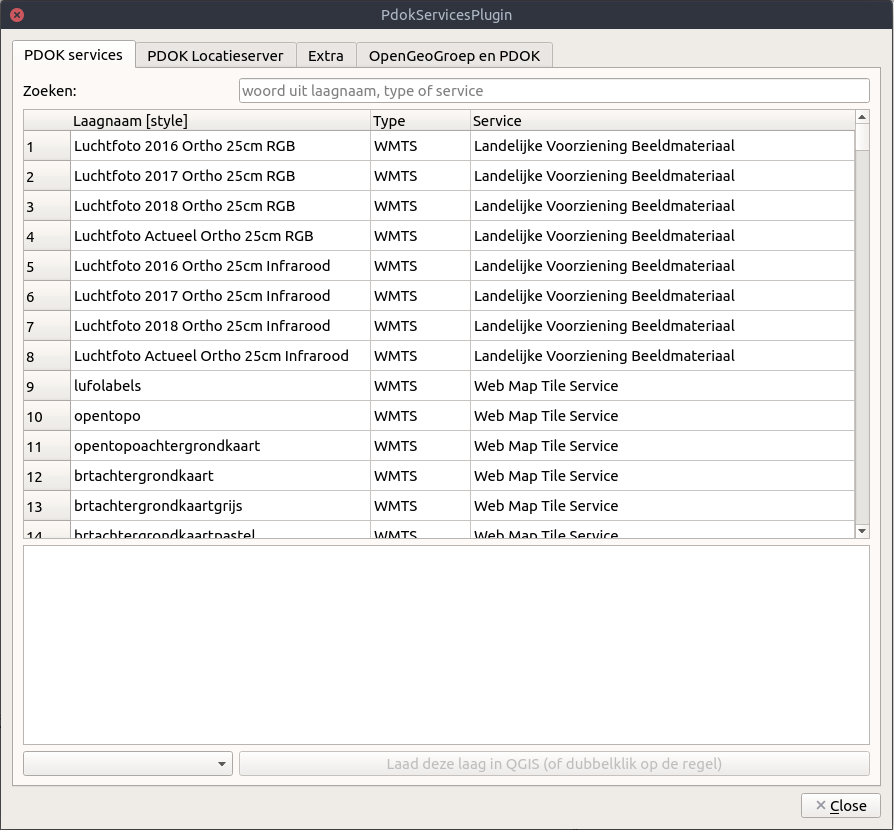
PDOK Services QGIS Plugin
NOTE: Comes pre-installed on the provided VirtualBox image
nationaalgeoregister.nl (NGR) is the Dutch national geo-portal, where open geospatial data sets are published by (mostly) public sector organizations. The NGR also contains data sets and services that are not provided by PDOK. Beside the web-interface NGR also provides API to search the catalogue programmatically, the service protocol of this API is CSW.
The standards in the list of traditional service standards are also known as the OGC Web Services (OWS). In API design these service types are very similar. For instance all service types use XML to exchange message between client and server. Also you can request for each service type a Capabilities document, which describes what that particular service instance is capable of. You can request a Capabilities document by sending a HTTP GET request with the following query parameters:
service={SERVICE_TYPE}&request=GetCapabilitiesFor instance for a WMS service the request looks like this:
https://geodata.nationaalgeoregister.nl/cbspostcode4/wms?request=GetCapabilities&service=WMS****NOTE:**** Below for each service type a couple of typical requests are listed, this is by no means an exhaustive list of request types in respective specifications!
WMS is a service protocol for maps; a WMS serves map images rendered from geographical data and styling rules. A WMS does not serve the actual data. WMS supports the following three requests:
Example WMS GetMap HTTP GET request:
https://geodata.nationaalgeoregister.nl/cbspostcode4/wms?SERVICE=WMS&VERSION=1.3.0&REQUEST=GetMap&FORMAT=image%2Fpng&TRANSPARENT=true&layers=postcode42017&CRS=EPSG%3A28992&STYLES=&WIDTH=2780&HEIGHT=929&BBOX=-937574%2C70963%2C1453670%2C870051A major disadvantage of the WMS protocol is that in potential every request to server is unique, because of the combination of the extent and the size of the image requested. This makes it impossible in practice to setup a caching layer for a WMS service. Generating map images is a CPU intensive process, response times of multiple seconds are not unheard of.
To overcome the CPU intensive on-the-fly rendering problem, application developers started using pre-rendered map tiles. Several open and proprietary schemes were invented to organize and address these map tiles. An earlier specification for this is the Tile Map Service (TMS).
The concept of map tiles and WMTS is that the zoomlevels are fixed, every zoomlevel is divided in a finite number of tiles. How the zoomlevels are organized is also known as a tilematrix. Most common is the use of a tilematrix piramide, on the lowest zoomlevel (0) 1 (4^0) map tiles and on the highest zoomlevel (22) 17592186044416 (4^22) map tiles. For each zoomlevel deeper, every tile is divided in four. But the WMTS spec does allow for more complex tile matrix sets.
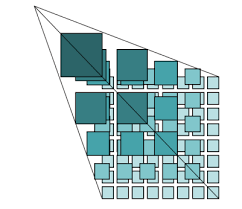
Tile matrix
WMTS specifies multiple request encoding, but to keep it simple only the key-value-pair encoding (KVP) is shown:
Requests:
Example KVP WMTS GetTile HTTP GET request:
https://geodata.nationaalgeoregister.nl/tiles/service/wmts?layer=brtachtergrondkaart&style=default&tilematrixset=EPSG%3A28992&Service=WMTS&Request=GetTile&Version=1.0.0&Format=image%2Fpng&TileMatrix=02&TileCol=2&TileRow=1WFS is a service protocol that serves features. A WFS is only concerned with vector data, for raster data there is WCS (Web Coverage Service). Just like a WMS a WFS supports querying the data by extent, but WFS also supports more advanced filtering capabilities, for instance querying on attribute value of the data.
Requests:
Example WFS GetFeature HTTP GET request:
http://geodata.nationaalgeoregister.nl/cbspostcode4/wfs?SERVICE=WFS&REQUEST=GetFeature&VERSION=2.0.0&TYPENAME=cbspostcode4:postcode42017&STARTINDEX=0&COUNT=200&SRSNAME=urn:ogc:def:crs:EPSG::28992&outputFormat=application/jsonCSW is a protocol to make metadata records on geospatial resources (such as data sets and services) searchable. The word catalogue in CSW is the catalogue of metadata records. The Dutch national geo-portal is nationaalgeoregister.nl (NGR). Almost all open geospatial data that are published by governmental organizations are registered in the NGR. NGR also provides a CSW endpoint, which can be used to query the catalogue programmatically.
An example CSW GetRecords HTTP GET request:
https://www.nationaalgeoregister.nl/geonetwork/srv/dut/csw?request=GetRecords&Service=CSW&Version=2.0.2&typeNames=gmd:MD_Metadata&constraint=keyword=%27defensie%27&constraintLanguage=CQL_TEXT&constraint_language_version=1.1.0&resultType=resultsBefore you begin with the workshop it is highly recommended to update this repository by running:
git pullThe workshop is divided in five sections, each sections builds on the previous section. This repository contains five sections branches, which holds a working example application for each section:
NOTE: All created applications in this workshop will use the cartographic projection Web Mercator
EPSG:3857. This is the de facto standard in map projections for web mapping applications. Governmental organizations in the Netherlands often require the use of the Amersfoort/RD NewEPSG:28992projection, some the map services of PDOK are only available in the Amersfoort/RD New projection. More information about map projections can be found on Wikipedia.
First start by modifying your profiles path in the Bash shell, edit the file ~/.profile and add the following line:
export PATH=./node_modules/.bin:$PATHNext make sure you load the changes in your profile by sourcing the profile file:
source ~/.profileThen run the following commands from the root of this repository:
mkdir webapp && cd webapp
npm init -y
npm install ol
npm install --save-dev parcel-bundler eslint
Setting up a linter helps with detecting syntax errors and conforming to a particular style guide. This workshop uses ESLint a JavaScript linter, setup ESLint by running eslinit --init and answer questions with:
To setup ESLint in VS Code, install the ESLint extension for VS Code. Then add the following to your VS Code preferences in settings.json (through File>Preferences then click icon in upper right corner to show the actual JSON):
"editor.codeActionsOnSave": {
  "source.fixAll": true
},
"eslint.workingDirectories": [ "./webapp" ]
This will make sure ESLint will run on save and detect the webapp directory as a working directory.
Now let's start coding, create the file index.js in the folder webapp with the following content:
import 'ol/ol.css'
import { Map, View } from 'ol'
import OSM from 'ol/source/OSM'
import TileLayer from 'ol/layer/Tile.js'
import {fromLonLat} from 'ol/proj'

var map = new Map({ // eslint-disable-line no-unused-vars
  target: 'map',
  layers: [
    new TileLayer({
      source: new OSM()
    })
  ],
  view: new View({
    center: fromLonLat([5.43, 52.18]),
    zoom: 8
  })
})
The above JavaScript file uses the OSM class to add the standard OpenStreetMap (OSM) tile layer.
Create the file index.html in the folder webapp with the following content:
<!DOCTYPE html>
<html>

<head>
    <meta charset="utf-8">
    <title>PDOK Webservices</title>
    <style>
        html,
        body {
            height: 100%;
            margin: 0px;
        }

        #map {
            height: 100%;
        }
    </style>
</head>

<body>
    <div id="map"></div>
    <script src="./index.js"></script>
</body>

</html>
Replace the scripts element in the webapp/package.json file with the following:
"scripts": {
    "test": "echo \"Error: no test specified\" && exit 1",
    "start": "parcel index.html",
    "build": "parcel build --public-url . index.html"
}
Now run the following command from the webapp/ directory:
npm startVisit http://localhost:1234/ to view the glorious result. If correct you should see a interactive map in your browser with the default OpenLayers basemap.
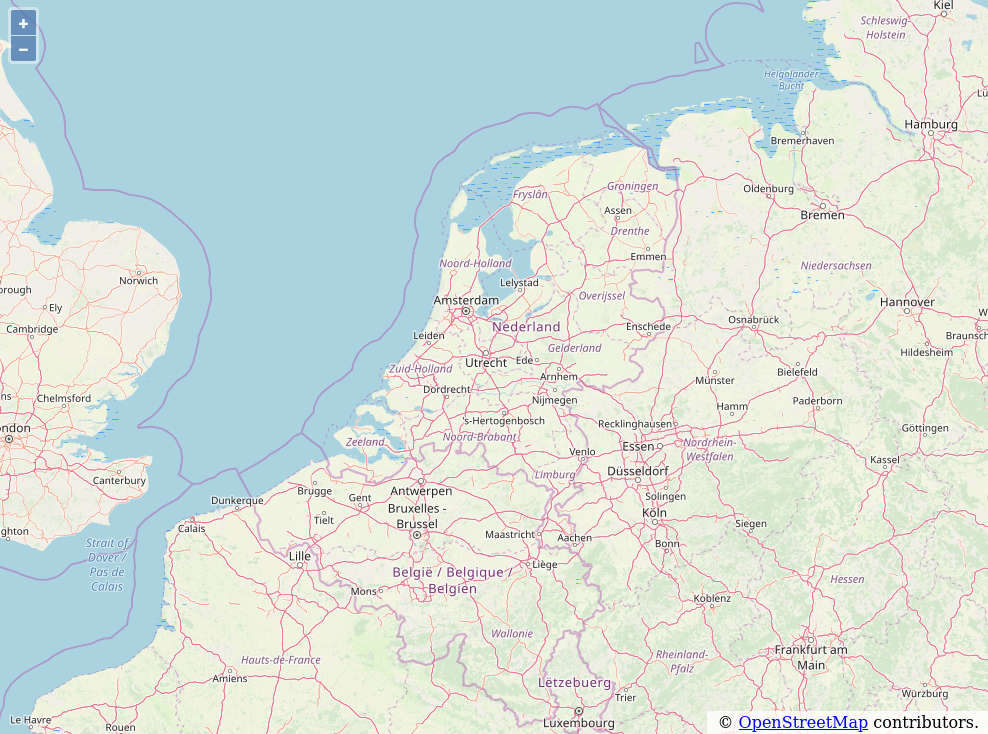
First map!
Now you are going to add a WMTS layer to your map as basemap layer.
Replace the code in index.js with the following:
import 'ol/ol.css'
import { Map, View } from 'ol'
import WMTSSource from 'ol/source/WMTS'
import TileLayer from 'ol/layer/Tile.js'
import WMTSTileGrid from 'ol/tilegrid/WMTS.js'
import { get as getProjection, fromLonLat } from 'ol/proj'
import { getTopLeft, getWidth } from 'ol/extent.js'

const projection = getProjection('EPSG:3857')
const projectionExtent = projection.getExtent()
const size = getWidth(projectionExtent) / 256
const resolutions = new Array(20)
const matrixIds = new Array(20)

for (let z = 0; z < 20; ++z) {
  // generate resolutions and matrixIds arrays for this WMTS
  // see https://openlayers.org/en/latest/examples/wmts.html
  resolutions[z] = size / Math.pow(2, z)
  matrixIds[z] = z
}

const baseMapLayer = new TileLayer({
  extent: projectionExtent,
  source: new WMTSSource({
    url: 'https://geodata.nationaalgeoregister.nl/tiles/service/wmts',
    layer: 'brtachtergrondkaartgrijs',
    matrixSet: 'EPSG:3857',
    format: 'image/png',
    attributions: 'Map data: <a href="http://www.kadaster.nl">Kadaster</a>',
    tileGrid: new WMTSTileGrid({
      origin: getTopLeft(projectionExtent),
      resolutions: resolutions,
      matrixIds: matrixIds
    }),
    style: 'default'
  })
})

const map = new Map({ // eslint-disable-line no-unused-vars
  layers: [
    baseMapLayer
  ],
  target: 'map',
  view: new View({
    center: fromLonLat([5.43, 52.18]),
    zoom: 8
  })
})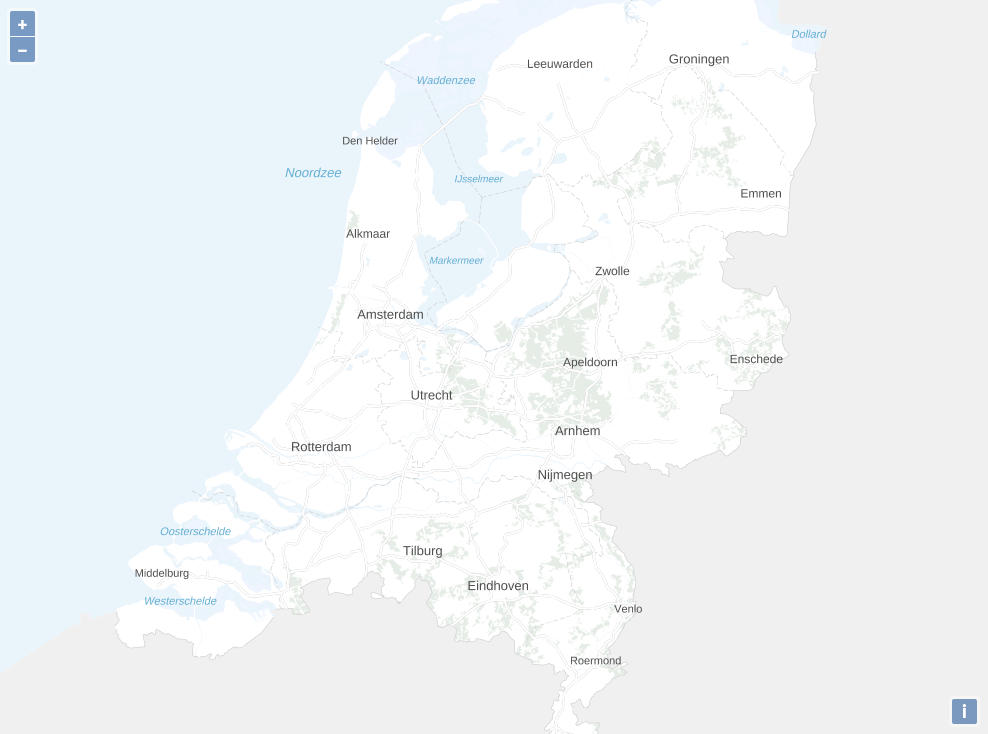
BRT-Achtergrondkaart
Now you are going to add a WMS layer to your map as basemap layer.
Now we have good looking basemap it is time to display something on top of it.
NWB Wegen data set which is also published as a WMS service. The Geo Services tab provides a WMS service url. The URL provided links to the capabilities document, which describes what the service is capable of. The capabilities document lists which layers, styles, image formats and projections are available and more.
To add the wegvakken layer from the WMS service to the map add the following to the index.js document before the declaration of the map object.
import ImageLayer from 'ol/layer/Image'
import ImageWMS from 'ol/source/ImageWMS'

const wmsSource = new ImageWMS({
  url: 'https://geodata.nationaalgeoregister.nl/nwbwegen/wms?',
  crossOrigin: 'anonymous',
  params: { LAYERS: 'wegvakken' }
})

const wsmLayer = new ImageLayer({
  extent: projectionExtent,
  source: wmsSource
})
Do not forget to add wsmLayer to the map object. We also need to set the zoomlevel of the initial view to 14 in order to see the WMS layer. This is due to the way this WMS service is configured, in the capabilities document the wegvakken layer has a MaxScaleDenominator property set to 50000. This means that the layer is visible from scale 1:1 until 1:50000. In terms of WMTS zoomlevels this means that layer is visible from zoomlevel 14 and up. The map object declaration should now look like this:
const map = new Map({ // eslint-disable-line no-unused-vars
  layers: [
    baseMapLayer,
    wsmLayer
  ],
  target: 'map',
  view: new View({
    center: fromLonLat([5.43, 52.18]),
    zoom: 14
  })
})
Your map application should now display the wegvakken layer:
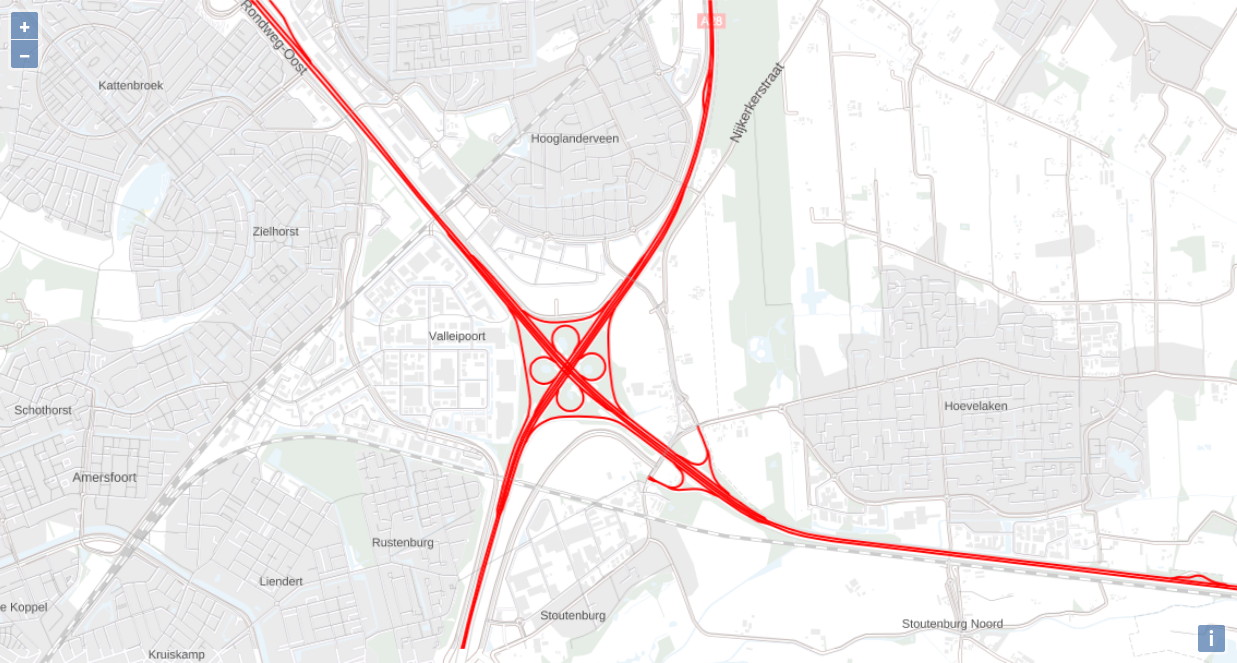
WMS layer
You will notice that this WMS is pretty limited in what it can do, it is hard to get a complete view of dataset with all the restrictions. In the next section we will address this issue.
The WMS standard provides a mechanism to retrieve information of features, the underlying vector data of the map. The request do retrieve feature information is called GetFeatureInfo. The WMS specification does not require the implementation of the GetFeatureInfo request, therefore a client should always check in the capabilities document if the service support the GetFeatureInfo request. The NWB-wegen WMS supports the GetFeatureInfo request, it is listed in the Capability/Request element in the XML.
In this section we are going to add functionality so show a popup with feature information when a users clicks on the map. To do this add the following to the body element of index.html, before the script.js inclusion:
<div id="popup" class="ol-popup">
    <a href="#" id="popup-closer" class="ol-popup-closer"></a>

    <div id="popup-content"></div>
</div>
Add the following code to index.js before the map constant declaration:
import Overlay from 'ol/Overlay'

// Elements that make up the popup.
var container = document.getElementById('popup')
var content = document.getElementById('popup-content')
var closer = document.getElementById('popup-closer')

// Create an overlay to anchor the popup to the map.
var overlay = new Overlay({
  element: container,
  autoPan: true,
  autoPanAnimation: {
    duration: 250
  }
})

// Add a click handler to hide the popup.
closer.onclick = function () {
  overlay.setPosition(undefined)
  closer.blur()
  return false
}
Add the overlay constant to the map object:
const map = new Map({ // eslint-disable-line no-unused-vars
  layers: [
    baseMapLayer,
    wsmLayer
  ],
  target: 'map',
  overlays: [overlay],
  view: new View({
    center: fromLonLat([5.43, 52.18]),
    zoom: 14
  })
})
Add the singleclick eventhandler on the map object below the map declaration in index.js:
map.on('singleclick', function(evt) {
  // clean content of popup on every new singeclick event
  if (content.childNodes.length > 0) content.childNodes[0].remove()
  var viewResolution = /** @type {number} */ (map.getView().getResolution());
  var url = wmsSource.getFeatureInfoUrl(
    evt.coordinate, viewResolution, 'EPSG:3857',
    {'INFO_FORMAT': 'application/json'});
  if (url) {
    fetch(url)
      .then(function (response) { return response.json() })
      .then(function (data) {
        // set overlay position to undefined to hide popup
        if (data.features.length === 0){
          overlay.setPosition(undefined)
          return
        }
        let ft = data.features[0]
        let table = document.createElement("table")
        var header = table.createTHead()
        var row = header.insertRow()
        let i=0
        Object.keys(ft.properties).forEach(function(item){
          let cell = row.insertCell(i)
          cell.innerHTML = item
          i++
        })
        let body = table.createTBody()
        row = body.insertRow()
        i=0
        Object.keys(ft.properties).forEach(function(item){
          let cell = row.insertCell(i)
          cell.innerHTML = ft.properties[item]
          i++
        })
        content.appendChild(table)
        overlay.setPosition(evt.coordinate)
      })
  }
})
Create a new index.css file in the root of the webapp folder and add the following CSS:
html, body {
    height: 100%;
    margin: 0px;
}


#map {
    height: 100%;
}

.ol-popup {
    position: absolute;
    background-color: white;
    box-shadow: 0 1px 4px rgba(0, 0, 0, 0.2);
    padding: 15px;
    border-radius: 10px;
    border: 1px solid #cccccc;
    bottom: 12px;
    left: -50px;
    min-width: 40vw;
    max-width: 60vw;
    padding-top: 20px;
}

.ol-popup:after, .ol-popup:before {
    top: 100%;
    border: solid transparent;
    content: " ";
    height: 0;
    width: 0;
    position: absolute;
    pointer-events: none;
}

.ol-popup:after {
    border-top-color: white;
    border-width: 10px;
    left: 48px;
    margin-left: -10px;
}

.ol-popup:before {
    border-top-color: #cccccc;
    border-width: 11px;
    left: 48px;
    margin-left: -11px;
}

.ol-popup-closer {
    text-decoration: none;
    position: absolute;
    top: 2px;
    right: 8px;
}

.ol-popup-closer:visited {
    text-decoration: inherit;
    color: inherit;
    cursor: auto;
}

.ol-popup-closer:after {
    content: "✖";
}


#popup-content {
    overflow-x: scroll;
}

table {
    border: none;
    border-collapse: collapse;
    font-family: sans-serif;
}

table td {
    border-left: 1px solid #ddd;
    border-right: 1px solid #ddd;
    padding-left: 0.5em;
    padding-right: 0.5em;
}

thead>tr>td {
    border-bottom: 1px solid #ddd;
    font-weight: 600;
}

table td:first-child {
    border-left: none;
}

table td:last-child {
    border-right: none;
}

tbody td:nth-of-type(odd), thead td:nth-of-type(odd) {
    background: #E6E6E6;
}
Remove the style element from the index.html file and replace with:
<link rel="stylesheet" type="text/css" href="index.css">Reload the webapp in the browser,now the map should display a popover when a feature is clicked on the map.
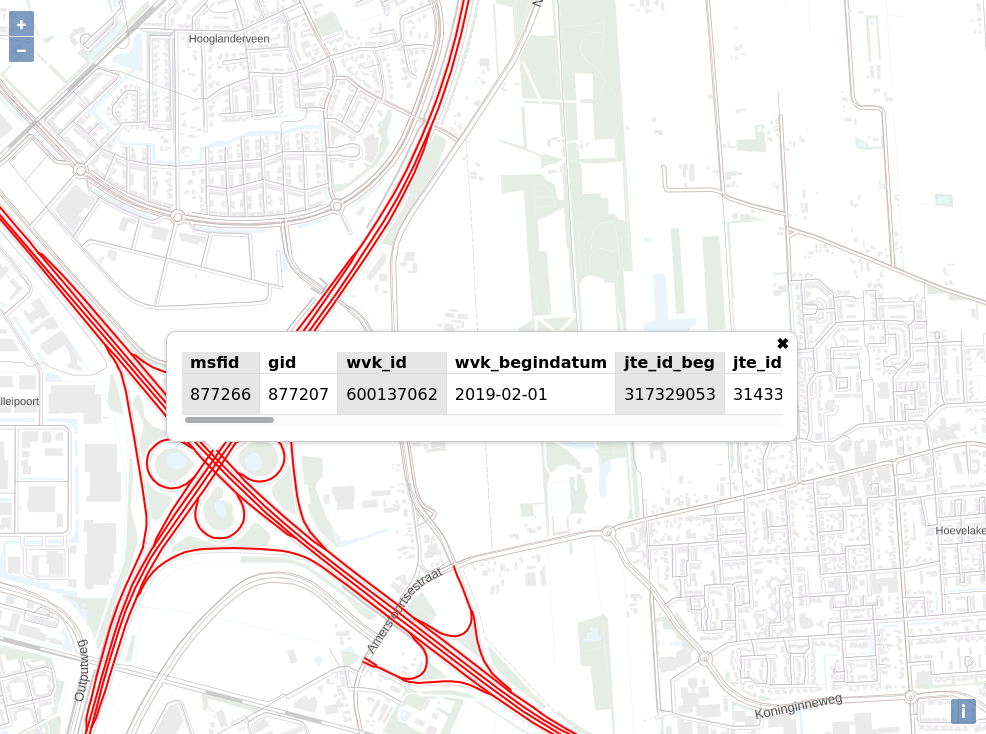
Feature information
What happens in the background is that OpenLayers registers on which pixel coordinate a user clicks. This is information is combined with the query parameters of the previous WMS GetMap request, to create a GetFeatureInfo request. In the below example GetFeatureInfo request the user clicked on pixel coordinate 50,50 of an image with WIDTH and HEIGHT of 101,101, this is the corresponding GetMap request.
https://geodata.nationaalgeoregister.nl/nwbwegen/wms?SERVICE=WMS&
VERSION=1.3.0&
REQUEST=GetFeatureInfo&
FORMAT=image%2Fpng&
TRANSPARENT=true&
QUERY_LAYERS=wegvakken&
LAYERS=wegvakken&
INFO_FORMAT=application%2Fjson&
I=50&
J=50&
CRS=EPSG%3A3857&
STYLES=&
WIDTH=101&
HEIGHT=101&
BBOX=603781.6790671768%2C6831433.221161786%2C604746.696549277%2C6832398.238643886A different approach to displaying geographical data is, instead of using WMS and WMTS services, downloading the vector data in the client and displaying the vector data directly. In this scenario there is no need for a server and gives you complete freedom of styling of the data. One major drawback of this approach is performance, processing power on the client is limited; there is a upper limit on the number of features you can load in your map (at once).
When rendering geographical data directly on the client rendering performance is a concern. You can optimize for this by preprocessing your data to either:
In this workshop we only do preprocessing of the data to reduce the size of the data set. This is done by selecting only the motorways (the A roads) and joining the separate segments into one geometry grouped by the road letter and road number combination (for instance group by A1, A2, A348). We will use the ogr2ogr commandline utility for data processing.
In this chapter you are going to create a map of the Dutch motor ways, directly rendered in the browser from a GeoJSON file. We will use the NWB-wegen data set, PDOK provides WMS en WFS services and also a direct download service. In this case we will use the PDOK download service, since we want to obtain the full data set.
NOTE: If you are using the VirtualBox image that comes with the workshop you do not need to download the file, it is already downloaded in
~/pdok-webservices-workshop/data.
First ensure your current working directory is ~/pdok-webservices-workshop (the root folder of this project):
cd ~/pdok-webservices-workshopThe data we are going to use is available in the ./data folder of this project. If needed the file can be downloaded through the following command.
curl "http://geodata.nationaalgeoregister.nl/nwbwegen/extract/nwbwegen.zip" -o data/nwbwegen.zipThen unzip:
unzip data/nwbwegen.zip -d data/Open the Shapefile in QGIS to inspect data from the NWB-wegen data set, Shapefile is located in data/geogegevens/shapefile/nederland_totaal/wegvakken/wegvakken.shp. This file can also be drag&drop in QGIS.
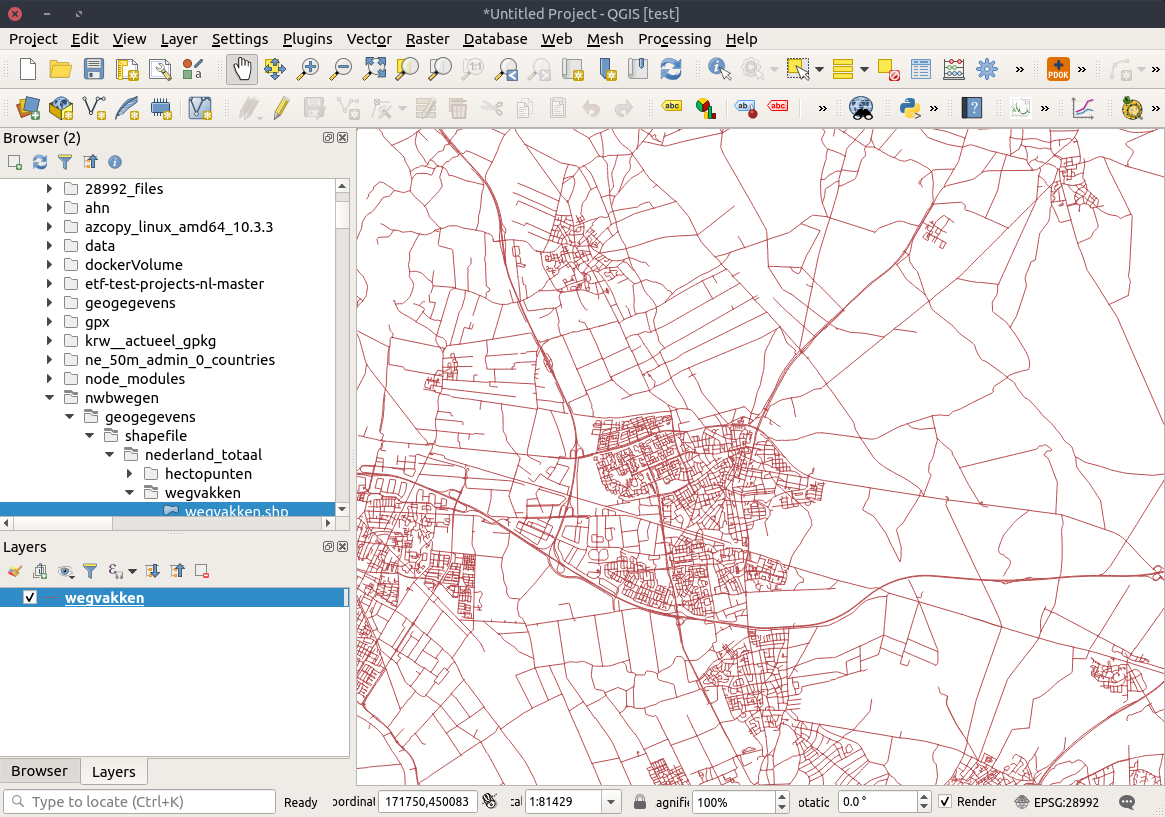
NWB Wegen in QGIS
You will notice that it takes some processing for QGIS to render all the features when viewing the full extent of the Netherlands. This is a sure sign your browser will have a hard time rendering all this data. To make life easy for the browser we will extract only the motorways from this data set.
Another concern is that the roads in the wegvakken layer from NWB-wegen are divided in many separate segments. This is not ideal for styling and labeling the in the webapp. Therefore we need to merge the geometries, and we can immediately group them by route-letter and route-number (A2, A10, A348).
First step is to convert the shapefile to GPKG and select only the A routes (GeoPackage is the superior geospatial file format, although Shapefile is refusing to go away).
ogr2ogr -f GPKG data/nwb.gpkg data/geogegevens/shapefile/nederland_totaal/wegvakken/wegvakken.shp -sql "select * from wegvakken where routeltr = 'A'" -nln wegvakken_aThe add a new column route to the wegvakken table and set the value to routeltr+routenr:
ogrinfo data/nwb.gpkg -sql "alter table wegvakken_a add column route TEXT"
ogrinfo data/nwb.gpkg -sql "update wegvakken_a set route=routeltr||routenr"
Now you are ready to group the geometries by the newly created route attribute and merge geometries of this group:
ogr2ogr -update -f GPKG data/nwb.gpkg data/nwb.gpkg -sql "SELECT ST_Union(_ogr_geometry_) as geom, route FROM wegvakken_a GROUP BY route" -nln snelwegen -nlt MULTILINESTRINGNow convert the snelwegen layer in the GPKG to GeoJSON:
ogr2ogr -f GeoJSON data/snelwegen.json data/nwb.gpkg -sql "select geom, route from snelwegen" -t_srs EPSG:3857 -nln snelwegenOpen snelwegen.json in QGIS, to verify whether you see the expected output, compare it with the intermediate layers in data/nwb.gpkg. You can style the layer based on the route attribute:
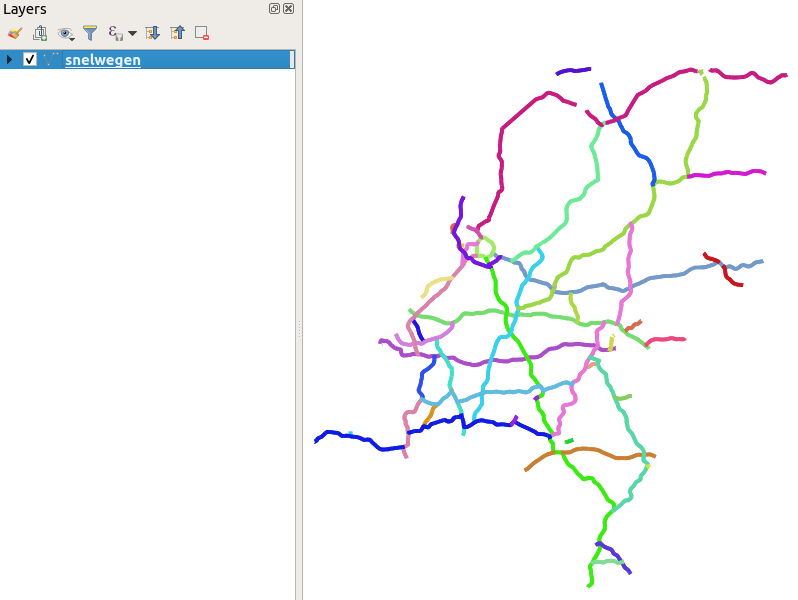
Snelwegen in QGIS
Then copy the snelwegen.json file to the webapp folder.
cp data/snelwegen.json webapp/Next we need to add some imports to the index.js file to display the GeoJSON file in your webapp:
import Point from 'ol/geom/Point'
import { Text, Fill, Stroke, Style } from 'ol/style'
import MultiLineString from 'ol/geom/MultiLineString'
import VectorLayer from 'ol/layer/Vector'
import { getCenter } from 'ol/extent'
import { Vector as VectorSource } from 'ol/source'
import GeoJSON from 'ol/format/GeoJSON'
import snelwegen from './snelwegen.json'
Remove the WMS layer and the click event handler, we are going to replace these with the GeoJSON layer.
Add the following to index.js and do not forget to add the snelwegenLayer to the map object:
function styleFunc (feature) {
  const styles = [
    new Style({
      stroke: new Stroke({
        color: 'red',
        width: 5
      })
    }),
    new Style({
      stroke: new Stroke({
        color: 'white',
        width: 1
      })
    })
  ]
  styles.push(new Style({
    geometry: function (feature) {
      var multiLineString = new MultiLineString(feature.getGeometry().getCoordinates())
      // labelPoint is the closest point on the line from the center of the extent of the geometry
      var labelPoint = multiLineString.getClosestPoint(getCenter(feature.getGeometry().getExtent()))
      return new Point(labelPoint)
    },
    text: new Text({
      text: feature.get('route'),
      font: '1em sans-serif',
      stroke: new Stroke({
        color: 'green',
        width: 6
      }),
      fill: new Fill({
        color: 'white'
      }),
      overflow: true
    })
  }))
  return styles
}

const snelwegenSource = new VectorSource({
  features: (new GeoJSON(
  )).readFeatures(snelwegen)
})

const snelwegenLayer = new VectorLayer({
  source: snelwegenSource,
  style: styleFunc,
  declutter: true
})
NOTE: you can also remove the popup div from
index.html, in that case do not forget to also remove thecloservariable from theindex.jsfile.
Refresh your browser to see the result:
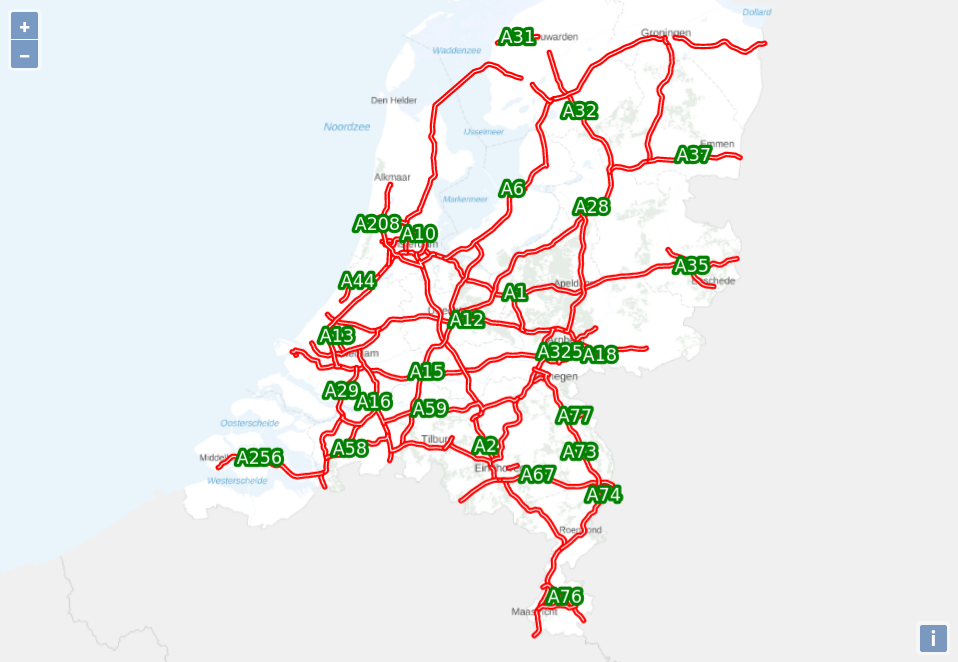
GeoJSON layer
With a simple modification of the style function the labeling can be made dynamic, based on the extent of the current view, this way all features in the current view are labeled. You can replace the var labelPoint in the function styleFunc:
var labelPoint = multiLineString.getClosestPoint(getCenter(map.getView().calculateExtent(map.getSize())))However this is not an ideal solution either due to the jumping labels on panning and zoomchange by the user. This can off course also be solved client side, but as you may realize labeling features is not a trivial problem.
Since we have the actual vector data loaded in the viewer, it is fairly easy to highlight features that have been clicked. Add the following to index.js:
var selection = {}

const selectionLayer = new VectorLayer({
  declutter: true,
  source: snelwegenLayer.getSource(),
  style: function (feature) {
    if (feature.get('route') in selection) {
      return new Style({
        stroke: new Stroke({
          color: 'yellow',
          width: 1.5
        })
      })
    }
  }
})

map.on(['click'], function (event) {
  const features = map.getFeaturesAtPixel(event.pixel, { hitTolerance: 3 })
  if (!features.length) {
    selection = {}
    selectionLayer.changed()
    return
  }
  const feature = features[features.length - 1]
  const identifier = feature.get('route')
  selection = {}
  selection[identifier] = feature
  selectionLayer.changed()
})
Do not forget to add the new selectionLayer to the map. Now when a feature on the map is clicked it will be highlighted.
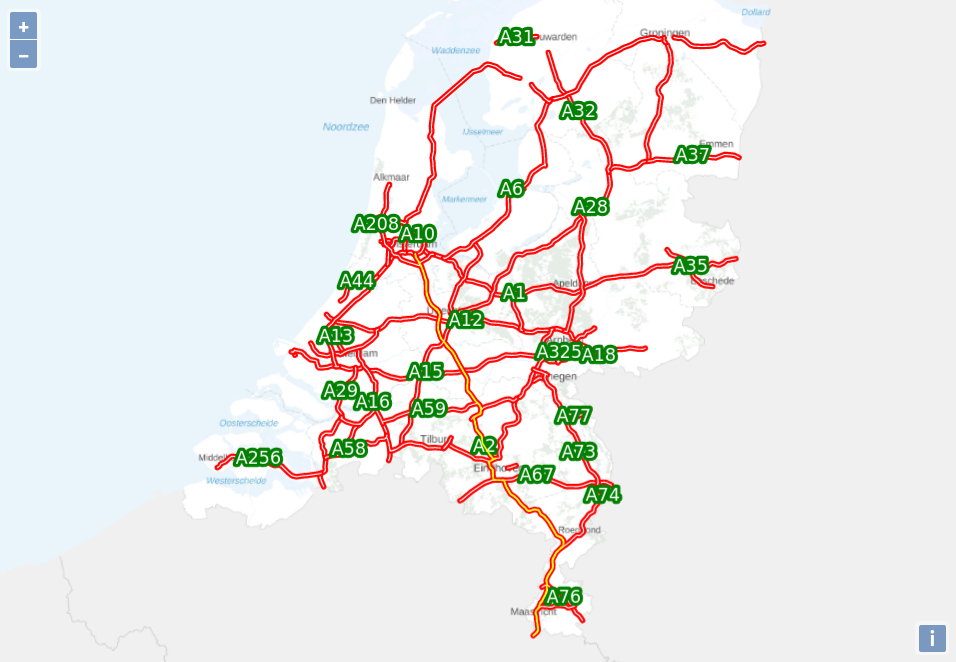
GeoJSON highlight
The PDOK Locatie Server might be the only PDOK service that does not implement a standardized service protocol. This probably due to the fact that there is no existing open standard for Gazetteer services. The PDOK Locatie Server allows to query locations by text; so you could ask the location in lat/long coordinates for Steenstraat Arnhem.
In this section we are going to add a input control to the map that accepts text. This text will be used to query the Locatie Server, and then display the results on the map.
To make life easier you will install the autocompleter npm dependency. This will take care of showing the list of suggestion for the input and take care of all the required event handling.
First install the autocomplete npm dependency, from the webapp folder run:
npm install autocompleterRemove popup html elements from index.html and remove the closer variable from the index.js file. Then add to index.css:
.ol-zoom.ol-control {
  top: 2em;
}
Now add to index.js:
import { Control } from 'ol/control'
import WKT from 'ol/format/WKT'
import autocomplete from 'autocompleter'
import 'autocompleter/autocomplete.css'

const locatieServerUrl = 'https://geodata.nationaalgeoregister.nl/locatieserver/v3'

var LocationServerControl = /* @__PURE__ */(function (Control) {
  function LocationServerControl (optOptions) {
    var options = optOptions || {}
    var input = document.createElement('input')
    input.id = 'input-loc'
    var element = document.createElement('div')
    element.className = 'input-loc ol-unselectable ol-control'
    element.appendChild(input)
    Control.call(this, {
      element: element,
      target: options.target
    })
  }
  /* eslint no-proto: 0 */
  if (Control) LocationServerControl.__proto__ = Control
  LocationServerControl.prototype = Object.create(Control && Control.prototype)
  LocationServerControl.prototype.constructor = LocationServerControl
  return LocationServerControl
}(Control))

map.addControl(new LocationServerControl())
If correct the map should display an input control:
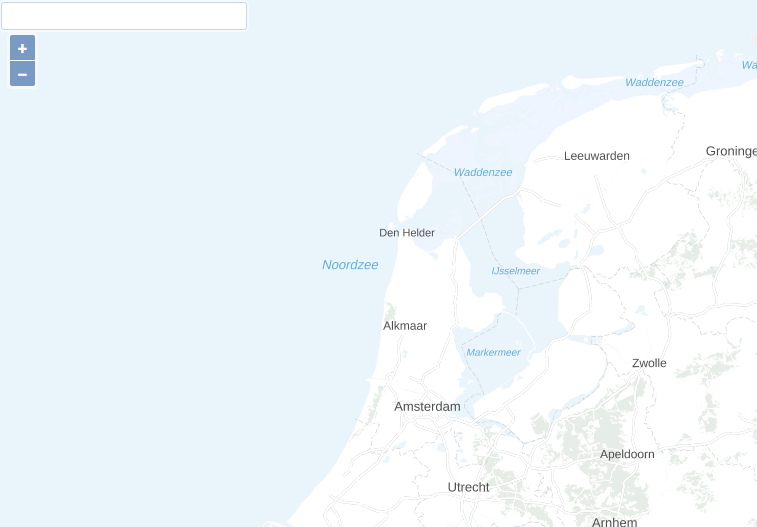
Autocomplete input
Nothing happens when you start typing in the input control. Let's change that! Add the the following to the function LocationServerControl below the Control.call section:
autocomplete({
      input: input,
      fetch: function (text, update) {
        fetch(`${locatieServerUrl}/suggest?q=${text}`)
          .then((response) => {
            return response.json()
          })
          .then((data) => {
            const suggestions = []
            data.response.docs.forEach(function (item) {
              const name = item.weergavenaam
              const id = item.id
              suggestions.push({ label: name, value: id })
            })
            update(suggestions)
          })
      }
    })
Now the control should display the suggestions:
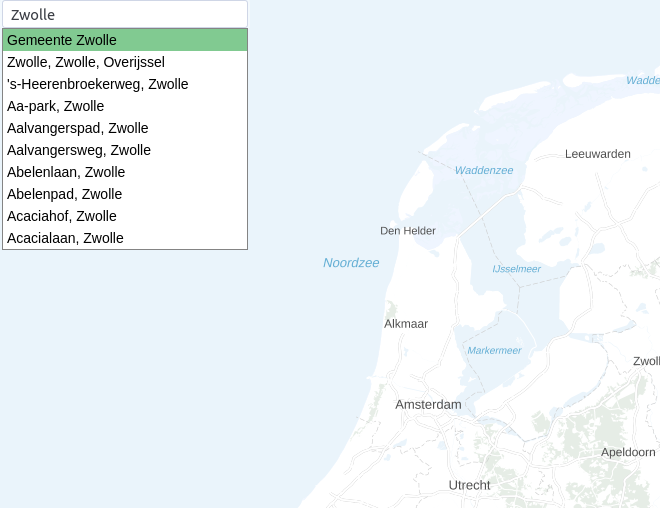
Autocomplete suggestions
Nothing happens when you select one of the autosuggest items, let's fix that. Add the following code below the fetch property in the autocomplete body:
onSelect: function (item) {
        input.value = item.label
        const id = item.value
        fetch(`${locatieServerUrl}/lookup?id=${id}&fl=id,geometrie_ll`)
          .then((response) => {
            return response.json()
          })
          .then((data) => {
            const wktLoc = data.response.docs[0].geometrie_ll
            const format = new WKT()
            const feature = format.readFeature(wktLoc, {
              dataProjection: 'EPSG:4326',
              featureProjection: 'EPSG:3857'
            })
            const ext = feature.getGeometry().getExtent()
            map.getView().fit(ext, map.getSize())
          })
      }
When you click an autosuggest item, the map will zoom to the location of the selected object. This can still be improved, as you can see, the lookup endpoint returns a geometry of the requested object. You can make this geometry visible by creating a VectorSource and VectorLayer, add the feature to the VectorSource and add the VectorLayer to the map.
const vectorSource = new VectorSource()

const vectorLayer = new VectorLayer({
  source: vectorSource,
  declutter: true
})
In the promise fulfillment of the lookup fetch add after creating the feature form WKT:
vectorSource.clear()
vectorSource.addFeature(feature)
Now when you select an item from the autosuggest list, the viewer will zoom to the object and display the geometry of the object on the map:
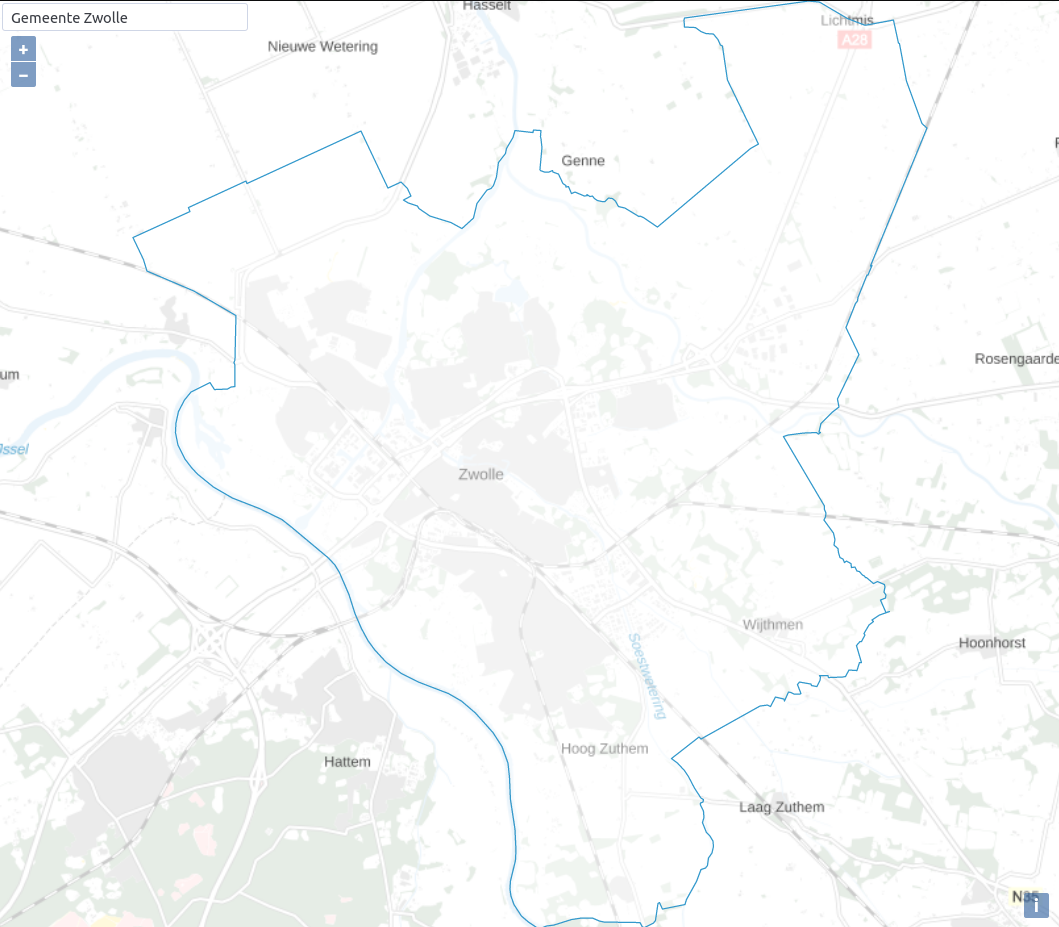
Autocomplete geometry
This concludes the workshop, congratulations to you for making it to the end! Now you can call yourself a commandline cartographer and build your own web map application. If your interested in more commandline cartography workshops make sure to check out the Command-Line Cartography blog posts by Mike Bostock. These workshop have a different approach, by using JavaScript based commandline tooling to process GeoJSON and TopoJSON and render them into SVG files, which can be displayed directly in the browser. No need for OpenLayers!